Grounding Beliefs
How to automate architecture docs
If you came for the docs, head over to the repo.
How a tweet prompted me to create a Gradle plugin
Picture this: you’re doom scrolling Twitter when a random tweet sends your brain into overdrive, questioning your whole approach to architecture docs. Intrigued? Me too! In this article, we’ll dive into my recent side project of creating a Gradle plugin that automates architecture diagrams using Mermaid.js, all thanks to a procrastination session on Twitter. Ready? Let’s go!
Background Story
I’ve always been a fan of diagrams, especially when it comes to software architecture or explaining complex flows. In my opinion, they are among the most valuable pieces of documentation one can have.
Over the years, my understanding of how to create meaningful architecture diagrams has evolved, thanks to experience and to a lot of online resources, like the insightful talk about the C4 model. It’s no surprise that I frequently use diagrams in my work now. There’s always a moment when it helps to illustrate a point or sheds light on an issue or feature. However, creating these diagrams has always been a manual process. I first take a look at the system, understand it, and then create a diagram to describe it.
My choice of tools for crafting diagrams has evolved as well. I initially drew them on physical drawing boards, but with the rise of remote work, I transitioned to using diagrams.net very often. Later, I moved on to Excalidraw mostly because of the aesthetics. Creating diagrams seemed simple enough: draw a few boxes and arrows, done!
However, that changed a bit when I saw the “X as-code” trend (e.g., infrastructure as code, configuration as code, etc), and I found out there was a similar approach for creating diagrams using code, with tools like Mermaid.js and PlantUML. At that point, I thought that this was exactly what I had been missing. Now, I could finally version an architecture diagram, track its evolution over time, and update them like any other documentation. Perfect! And that’s what I’ve been doing since.
It was all well and good, until I saw this tweet, which sent me down a rabbit hole:
"A diagram about the current system is only useful if it's generated. If it is produced by hand it documents the author's belief, not the system." 💯 https://t.co/aenK2eRW07
— Marcello Galhardo (@marcellogalhard) March 5, 2023
At first, I thought, “Do I really want to go through all the trouble of automating my diagrams? - No. I’m happy with the current approach.” Obviously, not long after that, during one of these discussions where I use a diagram to illustrate something, I realized that it was outdated/plain wrong. Then I saw it again on another project. Maybe an instance of the Baader-Meinhof phenomenon, but I digress.
Ok, I was convinced now. Finally, I decided to explore the idea of automating this thing.
Is there anyone doing this already?
Before spinning up my solution, I did some online research and came across this code by Jake Wharton that did something similar to what I wanted. His code parsed Gradle projects and generated a .dot file, which would then be used together with Graphviz to create a gradle module architecture graph jpg. Problem solved.
The drawback, however, was that to make this work, now I had to include Graphviz as part of the deal. This meant downloading and installing the tool, which isn’t exactly ideal for a CI/CD pipeline. Plus, it made it harder to version the diagram in a meaningful way since comparing jpg files isn’t as simple as diffing plain text. On top of that, I already knew that mermaid.js is supported by GitHub and GitLab, giving me another solid reason to pick it. (Not to mention that it’s a lot prettier than Graphviz. 😉)
From POC to Published Plugin
After some experimentation, I created a Gradle task to generate a Mermaid.js graph, you can see the first draft on this gist.
But hey, why stop there? I leveled up and crafted (and published) a full-blown gradle plugin! (yay! 🎉) You can find it on the Gradle Portal or give it a star 🌟 on Github. Keep an eye out for a future article detailing my road to creating and publishing my first Gradle plugin. Exciting stuff!
But for now, just know that it’s a very simple plugin that adds a task to your project and tries to play nicely with everybody else.
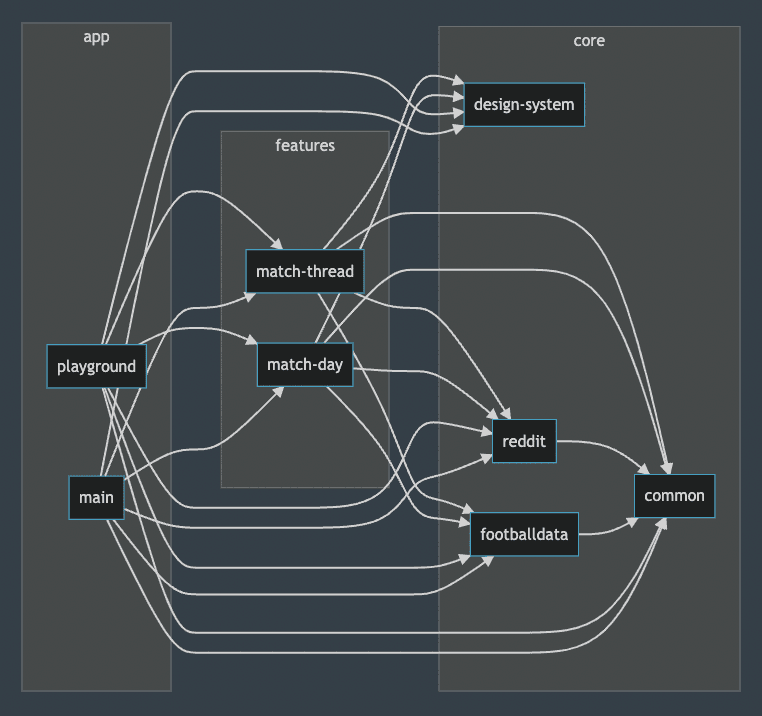
To get started, apply the plugin and simply run ./gradlew createModuleGraph
. Done! You’ll find a shiny
new mermaidjs graph added to your project’s README.md
file.
Now you can toss this command into your CI/CD pipeline to ensure your graph stays fresh and up-to-date.
Wrapping Up
And there you have it, folks! We’ve explored how to automate architecture diagrams using Gradle and Mermaid.js. No longer will you need to rely on outdated, hand-drawn diagrams or someone’s understanding of the system. Instead, you can trust the code to generate accurate, up-to-date pretty architecture graphs, keeping your documentation fresh and relevant.
So go ahead, give the module-graph plugin a try, and let it work its magic on your project. Also, I’m happy to hear your thoughts and feedback. This is my first plugin, and I’m sure we can improve it. Feel free to open an issue or contribute to the project on GitHub.